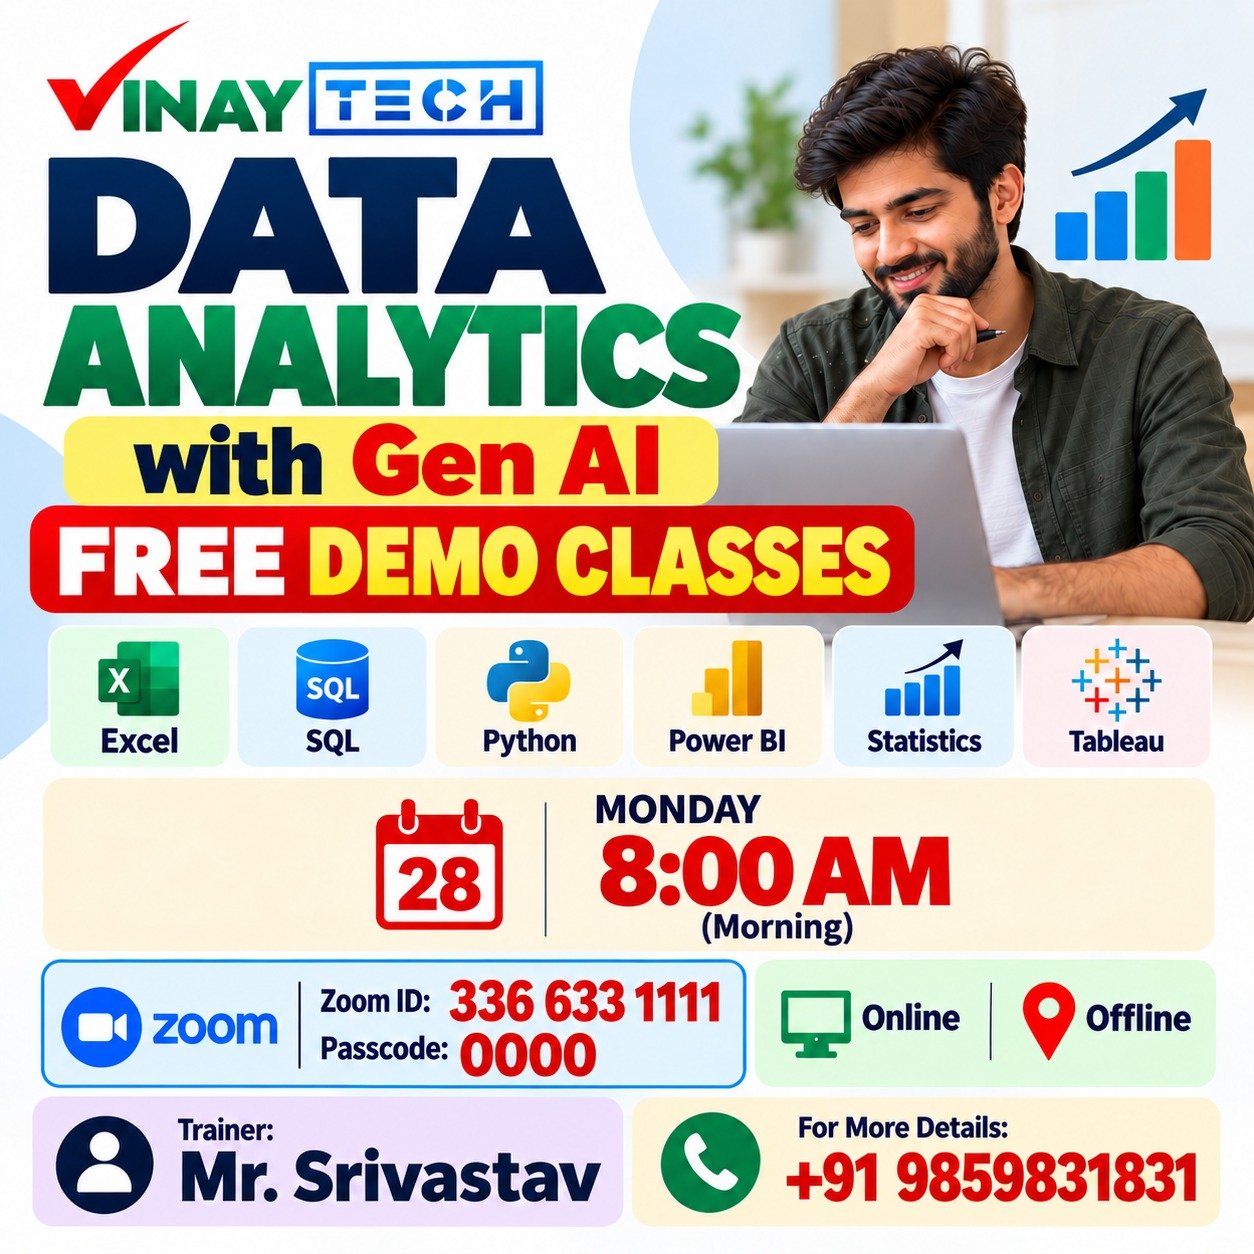
Transform your Career with
Data Analytics Course in Hyderabad
Over 300+ reviews

Get a Free Demo
What is Data Analytics?
Students can Expect
When you join our Data Analytics Course in Hyderabad, you can expect:
Project Based Learning
Engage in hands on, real world projects that mirror actual business challenges and data workflows.
Real Time Workflows
Understand how data analytics is applied in live business environments through case studies and practical scenarios.
Career-Focused Support
Benefit from resume building workshops, mock interviews, and job placement assistance to help you launch your career confidently.
Why learn Data Analytics Now?
Data Analytics helps businesses turn raw data into valuable insights, identify trends, and make informed decisions. Data Analytics Course in Hyderabad is suitable for students, freshers, graduates, and working professionals looking to develop practical analytics skills.
High Demand
Hyderabad’s IT, finance, healthcare, banking, e-commerce, and marketing industries use Data Analytics to improve performance and business decisions.
Learn In-Demand Tools
A Data Analytics Course in Hyderabad covers Excel, SQL, Python, Power BI, Tableau, Statistics, Power Query, Data Visualization, and Gen AI.
Beginner-Friendly
Start with Excel, SQL, Power BI, and Tableau without advanced programming knowledge, then progress to Python and advanced analytics.
Practical Skills
Learn data cleaning, analysis, visualization, reporting, dashboards, and business insights using real-world scenarios.
Career Opportunities
Build skills for roles such as Data Analyst, Business Analyst, Reporting Analyst, and BI Developer, while creating a foundation for Data Science, AI, and Machine Learning.
Learn more about the Microsoft Data Analyst Learning Path to build essential data analytics and Power BI skills.
What You’ll Learn
Data Cleaning & Preparation – Clean, transform, format, and prepare data for analysis.
SQL for Data Analytics – Write queries to filter, join, aggregate, and analyze data.
Excel for Data Analysis – Learn formulas, Pivot Tables, charts, and dashboards.
Power BI & Data Visualization – Create interactive dashboards, reports, KPIs, and visualizations.
Statistics for Data Analytics – Learn statistics, probability, correlation, regression, and analysis.
Python for Data Analytics – Learn Python basics and data analysis and visualization techniques.
Tableau for Data Visualization – Build interactive dashboards and visualize business data.
Gen AI for Data Analytics – Use Generative AI for analysis, SQL, formulas, insights, and productivity.
Real-Time Projects – Work on practical projects involving analysis, dashboards, and reporting.
Business Insights & Reporting – Present data findings and convert them into actionable insights.
What You Will Learn in Our Data Analytics Course
Our Data Analytics Course in Hyderabad is designed to help students, freshers, graduates, and working professionals develop practical skills in data analysis and visualization. The Data Analytics Course in Hyderabad covers data cleaning, SQL, Excel, Python, Power BI, Tableau, Statistics, Data Visualization, and Generative AI.
After Completing the Data Analytics Course, You Will Be Able To:
- Understand Data Analytics fundamentals, data types, and data processing.
- Clean, transform, and prepare data from multiple sources.
- Analyze data using Excel, SQL, Python, Power BI, and Tableau.
- Create interactive dashboards, reports, and KPIs.
- Apply statistics to identify trends, patterns, and relationships.
- Write SQL queries to extract, filter, join, and analyze data.
- Perform Exploratory Data Analysis (EDA) using practical datasets.
- Build data models and apply data transformation techniques.
- Use Gen AI for Data Analytics to assist with queries, formulas, insights, and automation.
- Work on real-time projects and business case studies.
- Present data insights clearly for better business decisions.
- Understand basic concepts of predictive analytics and machine learning.
- Learn essential data privacy, security, and responsible data usage practices.
- Develop skills for roles such as Data Analyst, Business Analyst, BI Developer, and Reporting Analyst.
Career Roles After Data Analytics Course
Data Analyst
Business Analyst
Reporting Analyst
Power BI Developer
Data Consultant
Marketing/Data Research Analyst
Graduates
Working Professionals
Career Change
Tools and technologies covered in a course
For only Recorded Sessions / Corporate Training, Contact us at +91 9859 831 831
Data Analytics Course Features
Learn Data Analytics in Hyderabad, From Basics to Advanced

Expert Trainers
Learn from experienced data professionals with real-world industry backgrounds in analytics, business intelligence, and data science.
Comprehensive Curriculum
Covers all essential tools and techniques including Excel, SQL, Power BI, and Python, from beginner to advanced levels.
Real Time Projects & Case Studies
Work on industry relevant datasets and real world projects to build practical skills that you can apply immediately on the job.
Placement Assistance
Get career-ready with resume preparation, mock interviews, and job placement assistance tailored to the analytics job market.
Certification
Earn a recognized Data Analytics certification that boosts your resume and validates your skills to employers.
Lifetime Learning Support
Access course materials, recordings, and instructor support even after course completion for continuous learning and doubt resolution.
Data Analytics Course in Hyderabad
CURRICULUM
Excel Course Content With AI Integration
⭐ Description of the Interface
⭐ The Menu System
⭐ The Fundamentals of Spreadsheets
⭐ Changing Excel’s Default Options using Autocorrect and Customizing It
⭐ Customizing the Ribbon
⭐ Using Functions – Sum, Average, Max, Min, Count
⭐ Customizing the Ribbon
⭐ SumIf, SumIfs CountIf, CountIfs AverageIf, AverageIfs
⭐ Upper, Lower, Proper
⭐ Left, Mid, Right
⭐ Trim, Len, Exact
⭐ Concatenate
⭐ Find, Substitute
⭐ Formatting Cells with Number formats, Font formats, Alignment, Borders, etc
⭐ Basic conditional formatting
⭐ File level Protection
⭐ Workbook, Worksheet protection
⭐ A description of the interface
⭐ Customizing Headers & Footers
⭐ Designing the structure of a template
⭐ Designing the structure of a template
⭐ Paste Formulas, Paste Formats
⭐ Transpose Tables
⭐ Paste Validations
⭐ Today, Now
⭐ Date, Date if, DateAdd
⭐ Day, Month Year
⭐ Month, weekday
⭐ New Charts – Tree map & waterfall
⭐ Combo Charts – Secondary Axis
⭐ Sunburst, Box, and Whisker charts
⭐ Using Power Map and Power View
⭐ Adding slicers Tool in Pivot & Tables
⭐ sparklines – Line, column & Win/Loss
⭐ Forecast Sheet
⭐ Smart Lookup and manage Store
⭐ New Controls in pivot Table – Field, Items, and Sets
⭐ Using 3-D Map
⭐ Autocomplete a data range and list
⭐ Filtering on Text, Numbers & Colors
⭐ Sorting Options
⭐ Advanced Filters on 15-20 different criteria(s)
⭐ Setting Print Area
⭐ Print Titles – Repeat Rows/Columns
⭐ Designing the structure of a template
⭐ customizing headers & Footers
⭐ Goal Seek
⭐ Data Tables (PMT Function)
⭐Solver Tool
⭐Scenario Analysis
⭐ TODAY, NOW, DATE, YEAR, MONTH, DAY
⭐ NETWORKDAYS, WORKDAY, WEEKDAY, EDATE, EOMONTH
⭐ DATEDIF, DATEVALUE, TIME, TIMEVALUE, TEXT, YEARFRAC
⭐ PMT, FV, PV, RATE, NPER
⭐ IPMT, PPMT, NPV, IRR
⭐ ISERROR, ISNA, ISBLANK, ISNUMBER, ISTEXT, ISLOGICAL
⭐ New Charts: Tree Map, Waterfall, Sunburst, Box & Whisker
⭐ Combo Charts with Secondary Axis
⭐ 3-D Maps, Power Map, Power View
⭐ Pivot Enhancements: Slicers, Timelines, Fields, Items, Sets
⭐ Quick Analysis Tool, Smart Lookup
⭐ AutoComplete & Forecast Sheet
⭐ Sparklines (Line, Column, Win/Loss)
⭐ Filter by Text, Numbers, Colors
⭐ Advanced Filters (15–20 criteria)
⭐ Array Formulas
- TRANSPOSE, FREQUENCY, LARGE, SMALL
- RAND, RANDBETWEEN, SEQUENCE, UNIQUE
- FILTER, SORT, SORTBY, TEXTJOIN, CONCAT
⭐ Goal Seek
⭐ Data Tables
⭐ Solver Tool
⭐ Scenario Analysis
⭐ Number, Date & Time Validation
⭐ Dynamic Dropdown List Creation using Data Validation -— Dependency List
⭐ Custom validations based on a formula for a cell
⭐ Text and List Validation
⭐ If Function
⭐ Complex if and or functions
⭐ Nested If
⭐ How to Fix Errors — iferror
⭐ What are the Array Formulas, Use of the Array Formulas?
⭐ Array with if, len, and mid functions formulas.
⭐ Basic Examples of Arrays (Using ctrl+shifttenter).
⭐ Advanced Use of formulas with Array.
⭐ Array with Lookup functions
⭐Vlookup / HLookup
⭐ Vlookup with Helper Columns
⭐ Creating Smooth User Interface
⭐ Index and Match
⭐ Reverse Lookup using Choose Function
⭐ Nested VLookup
⭐ Worksheet linking using Indirect
⭐ Creating Simple Pivot Tables
⭐ Classic Pivot table
⭐ Basic and Advanced Value Field Setting
⭐ Calculated Field & Calculated Items
⭐ Grouping based on numbers and Dates
⭐ Using SLICERS, Filter data with Slicers
⭐ Various Charts i.e. Bar Charts / Pie Charts / Line Charts
⭐ Manage Primary and Secondary Axis
⭐Planning a Dashboard
⭐ Adding Dynamic Contents to Dashboard
⭐ Adding Tables and Charts to Dashboard
POWER BI Course Content
MANDATORY Topic 1: POWER BI DEMO AND DATA WAREHOUSE FUNDAMENTALS
⭐ Data, Data Availability types in IT
⭐ IT data storage areas [File stream, Database]
⭐ Data warehouse, BI definitions and layers
⭐ Power BI existence in IT, Product services
⭐ Power BI Tools and Components
⭐ On-Premise vs. Cloud
⭐ OLAP vs. OLTP vs. Insights and Analytics
MANDATORY Topic 1: POWER BI DEMO AND DATA WAREHOUSE FUNDAMENTALS
⭐ Data warehouse, Data Mart and differences
⭐ Types of data marts and real-time usage
⭐ DWH Life Cycles DWH principles
⭐ DWH Approaches (INMON and KIMBALL)
⭐ Data Granularity, Data movement stages
MANDATORY Topic 2: DATA MODEL THEORY AND PRACTICAL
⭐ Data model, use of data model in Power BI
⭐ Business, Conceptual, Logical, Physical models
⭐ Dimension, Dimension table & types
(Conformed, Roleplay, Degenerated, Junk, SCD)
⭐ Measures & Types
(fully additive, semi additive, non additive)
⭐ Fact table & Types
( Snapshot, Incremental, Factless fact)
⭐ Schemas (Star, Snow Flake, Galaxy & Hybrid)
⭐ Surrogate key and usages in real time
⭐ 1:1, 1: Many, Many: Many relationships
⭐ Active, Inactive relationships
⭐ Single and Bi-directional, Cross filter
⭐ Advanced properties of fields
(sort order, date category, aggregators)
⭐ Snow Flake schema exmaples
TOPIC 1: INSTALLATION [POWER BI DESKTOP, GATEWAY, SERVER, REPORT BUILDER & DAX STUDIO]
⭐ Power BI Cloud / Report Server Desktop installation
⭐ DAX Studio installation, Gateway Installation
⭐ Report Server Installation
⭐ Paginated Report Builder Installation
TOPIC 2: WORKING WITH POWER BI DESKTOP AND CONNECTING TO MULTIPLE DATA SOURCES
⭐ Desktop over view and building blocks of
PBI Desktop
⭐ Connecting to various sources and
retrieving data
1. Flat, CSV, JSON, Excel files
2. Databases (SQL Server & Oracle)
3. Web
4. Multiple files load at a time
5. Azure SQL database and DWH
6. Analysis Services Models
(Tabular & ulti-dimensional)
7. Python Script
8. M-Retrieval
TOPIC 3: WORKING WITH DATABASES, CUBES, MODES & CHANGING MODES
⭐ Working on data modes[very detailed]
a)Import b)Direct Query c)Connect Live d) Mixed mode e) Chanding modes
⭐ Differences between Load and Edit options.
⭐ Retrive date from related data bases and cube
TOPIC 4: WORKNG ON POWER BI DESKTOP COMPONENTS
Power Query, Power Pivot, Power View, Power Map
TOPIC 5: POWER VIEW MENU TAB OPTIONS-RIBBON OPTIONS & REAL-TIME
a)New, Open, Save report
b)Export Power BI Template (PBIT), PDF
c)Import Power BI Template, Power Query,
View, Model, Visual files
d)Options and Settings & About
a)External Data:
Get Data, Recent Sources, Enter Data
b) Transform data & edit parameters
c) Publishing to cloud service
d) Prop data AI (2025)
e) Quick sources
f) Sensitivity
⭐ Report Phone Layout / Desktop View
Show Gridlines, Snap Objects to Grid
Locking Objects on the surface
⭐ Bookmarks creation, viewing, & using in
Dashboard Selection Pane
[Hiding and showing objects]
⭐ Slicer and Sync Slicers explanation with
practical Performance analyzer test run
⭐ Scale to fit: Page view, Mobile: Mobile
layout, Page options
⭐ Show panes: Filters, Bookmarks, Selection,
Performance Analyzer, Sync slicers
⭐ Visuals: New Page, New Visual, More Visuals
⭐ AI Visuals: Key Influencers, Decomposition
Tree, Smart Narrative, Q & A
⭐ Elements: Text box, Buttons, Shapes, Image
⭐ Power Platform: Paginated Report,
Power Apps, Power Automate
⭐ Sparklines: Add a Sparkline
a) Edit interactions for the visual for
cross highlighting, cross filtering, and
none options.
b) Bring forward, send backward etc…
visual option (Z-Order)
a) Drill down report creation
b) Drill one level down, multiple levels, &
data drill
c) Visual table, Data point table
a) Relationships: Manage Relationsips
b) Create roles and implement row-level
security & dynamic row-level security
Page Refresh: Change detection
Parameters: New parameter
Security: Manage roles, View as
Calculations: New measure, Quick measure,
New column, New table
Q & A: Language, Lunguistic Schema
a) Guided learning, documentation, training videos, blogs, communities, Power BI for developers, support and consulting services
⭐ DAX studio
⭐ Refresh, Pause, Preset, Optimization
TOPIC 6: POWER BI DATASET PROPERTIES
⭐ Create hierarchies and analyzing data
⭐ Create Groups (List, Bin)
⭐ Hide / Unhide columns usage in real-time
⭐ Consider table as Date Table
⭐ Expand and collapse columns
⭐ Incremental refresh & manage aggregations
TOPIC 7: POWER QUERY PROPERTIES [ 8 types of properties and M-Language ]
a) Practical on duplicates & references
b) Create groups to classify tables
c) Refreshing table data, Creating reusable functions
a) Data transformations by adding, removing & retaining columns, duplicates, error
b) Working on reusable functions
c) Merging & Joining multiple queries
⭐ Column Properties
⭐ Numeric, text, date tranforms
⭐ Numeric, text & date tranforms
⭐ Working on Any, List & Query parameters
⭐ Working on multiple & cascading parameters
⭐ Transpose rows, reverse rows, Pivot & Unpivot
⭐ Quality Transforms [profiling, quality, distribution]
⭐ Syntax, protocols, variables & conventions
⭐ Let, In, semicolon, and other functions
TOPIC 8: POWER BI VIEWS, FILTERS, VISUALS AND VISUAL FORMATING OPTIONS
a) Report
b) Data
c) Relationship
d) DAX Query
⭐ Visualization
⭐ Page
⭐ Report
⭐ Card, Multi-row, Table, Matrix, New -card (2024)
⭐ KPI, Gauge, Bullet Chart
⭐ Charts
⭐ Rounded charts : Pie, donut
⭐ Bar: Stacked, Clustered, 100% Stacked
⭐ Trend: Line, Area, Stacked Area, Ribbon, Mixed, Treemap,
Funnel, Scatter, Waterfall
⭐ Maps (Bubble, Filled, Shape, ARCGis, Azure map 2024)
⭐ AI Visuals: Key-influencer, De-composition, Smart Narrative, QA
⭐ Others: Sparklines, Metric, Paginated Report, R, Python
a) Bullet Chart
b) Chiclet Slicer
c) Hierarchy Slicer
d) Gantt Chart
e) Histogram Chart
f) Dual KPI
g) Scroller
a) Image
b) Textbox
c) Shapes
d) Button actions
Actions: Bookmark, page navigation, back , QA, URL, apply slicers & clear slicers
a) Slicers: types, usages, sync slicer
b) Filers & types
c) Edit Interactions
d) Parameters & What-if parameters
TOPIC 9: POWER BI CLOUD SERVICE (app.powerbi.com)
1) Navigation pane, Portal URL
2) App Launcher, Settings, Help & Support
3) Feedback, Account Information
⭐ My workspace and properties
⭐ User app workspaces and properties
⭐ Workspace Settings and Roles
⭐ Workspace Access
⭐ Create dashboards
⭐ Add the below tiles
⭐ Image, Textboc, Video, Streaming,
⭐ Live page, Visual, Bookmark, Workbook,
⭐ Insight, Usage metrics
⭐ Share and Subscribe dash board
⭐ Refresh Dashboard
⭐ Manage Alerts
⭐ Create, modify, and delete appspace
⭐ Add content (show or hide)
⭐ Audience (organization or users)
⭐ Additional Settings (copy, build)
⭐ Publish and Update app
⭐ Browse App in Web, Desktop and Mobile
⭐ END USER EXPERIENCE PROVIDED
⭐ Report Server Desktop and Report Server install and practice.
TOPIC 10: DAX - The below are the DAX categories, a few important functions covered for 6-7 hours
⭐ Syntax and usage
⭐ Naming conventions, parameters
⭐ Operators, functions (15 categories)
⭐ Context transition (row, column, filter, multi-row)
⭐ DAX Queries, DAX Studio and SSMS
⭐ DAX FAQS, Optimization & Standards
Good material provided for all the functions
a) Date
b) Filter
c) Math & Trig
d) Statistical
e) Table Manipulated
f) Informational
g) Relationship
h) Logical
i) Parent Child
j) Time Intelligence
k) INFO Function
l) Windows Functions (2022 Dec)
NEW Functions (2024)
Statements: Evaluate, Define, Var, Order By
Calendar, Calendarauto, Day, Month, Year YearFrac, Date, Time, DateValue, TimeValue, Edate, EOMonth, Weekday, WeekOfMonth Today, UTCToday, Now, UTCNow, DateDiff
DatesBetween, DatesInPeriod, ClosingBalanceofmonth, Quarter, Year OpeningBalanceOfMonth, Quater, Year Datesytd, Datesqtd, Datesmtd, Totalqtd, Totalmtd, Totalytd ,FirstDate, LastDate, FirstNonBlankDate, Lastnonblankdate, NextDay, NextMonth, NextYuarter, NextYear, ParallelPeriod, SamePeriodLastYear, PreviousDay, PreviousMonth, Quarter, Year StartOfMonth, Quarter Year
And, Or, Not, Iferror, If, Switch, In, True , False, Coalesce
Path, Pathlength, Pathcontains, Pathreverse, PathItem
INFO- View.Measures, View.Columns, View.Tables
Index, Offset, Partition, Window
Addmissingitems, Filter, Filters,Distinct, Values, Countrows, All, Allexcept, Earlier, Earliest, KeepFilters, Remove filters, Calculate, Calculatetable, AllSelected, AllNoBlankRow
Related, Relatedtable, UseRelationship, Crossfilter, ContainsStringExact
ContainsRow, Contains, ContainsString, Iseven, Isodd, Istext, UserName, UserPricipalName, LookUpValue, IsError, IsNonText, IsNumber, IsLogical, Isinscope, Isonorafter,Hasonefilter, IsCrossFiltered
Sum, Sumx, Average, AverageX, AverageA, Max,MaxX,MaxA, Min, Minx,MinA,Count, CountX, CountA, CountBlank, DistantCount, DistantCountNoBlank, Product, ProductX, Courtrows, Approximate, Distinctcount
Round, MRound, Roundup, Rounddown, Rand, RandBetween , Sqrt, Trunc, ln, Ceiling, Floor, Gcd, Lcd, Exp, Fact, Even, Odd, ABS, Convert, Currency, Sign
Permut, Rank.eq, Rankx, Sampl,
Statistical data, Operation functions
More DA Statical functions covered
AddColumns, AddMissingItems, CrossJoin, CurrentGroup, DataTable, DetailRows, DistinctColumn, DistinctTable, Except,Filters, Generate, GenerateSeries, Groupby, DataTable, Except, Intersect, Union, Symmarize, Summarizecolumn, GenerateSeries, NaturalInnerJoin, NaturalLeftOuterJoin, Crossjoin, Treatas, Isempty, Row SelectColumns, Values,
Blank, Code,Unichar,Concatenate, Combinevalues, Cacatinatex, Trim, Rept, Replace, Substitute, Find, Search, Format, Mid, Left, Right, Value, Upper, Lower
First, Last, Previous, Next, Rank, Rownumber, Lineast, Match
Python for Data Analytics
⭐ What is Python
⭐ What are the popular programming languages
⭐ Why choose python over other programming languages
⭐ How is python perfect for Data Analytics
⭐ Job opportunities after completion of the python course
⭐ Different types of IDEs used for Python programming
⭐ Python Installation
⭐ The print statement
⭐ Comments
⭐ Keywords
⭐ Operators
⭐ Variables
⭐ Data types
⭐ Sequences, mutable and immutable objects
⭐ Type casting
⭐ String operations
⭐ Indexing and Slicing
⭐ Simple programs with user input
⭐ Indentation
⭐ Simple if statement
⭐ If else statement
⭐ Elif statement
⭐ Nested if condition
⭐ One line if conditions or short hand if conditions
⭐ List
⭐ Tuple
⭐ Set
⭐ Dictionary
⭐ Nested collections
⭐ Comprehension programming on Lists and Dictionaries
⭐ Real time examples using Collections
⭐ Built in functions
⭐ User defined functions
⭐ Function with no arguments and no return value
⭐ Function with arguments but no return value
⭐ Types of arguments
⭐ Local and global variables
⭐ Recursive functions
⭐ Lambda function
⭐ Mapping, filter and reduce
⭐ Built in modules
⭐ User defined modules
⭐ Built in functions
⭐ User defined functions
⭐ Function with no arguments and no return value
⭐ Function with arguments but no return value
⭐ Types of arguments
⭐ Local and global variables
⭐ Recursive functions
⭐ Lambda function
⭐ Mapping, filter and reduce
⭐ Built in modules
⭐ User defined modules
⭐ Types of Errors
⭐ Exception handling
⭐ Try, except, finally
⭐ Raise
⭐ Findall
⭐ Tuple
⭐ Split
⭐ Sub
⭐ Regex Functions with meta characters
⭐ Open(), read(), write(), close()
⭐ Export data to text files
⭐ Basic concepts of OOP
⭐ Difference between general programming and OOP
⭐ Classes and Objects
⭐ init () method
⭐ Self parameter
⭐ Single inheritance
⭐ Multilevel inheritance
⭐ Multiple inheritance
⭐ Hierarchical inheritance
⭐ Polymorphism
⭐ Data structures in Pandas : Series and DataFrames
⭐ Import and Export data
⭐ Working with Excel, CSV, Json, Delimited data files
⭐ Sorting data (Ascending/Descending)
⭐ Loc[] and iloc[]
⭐ Search and Filter data
⭐ Value_Counts
⭐ Grouping data
⭐ Pivot tables
⭐ Merging data
⭐ Concatenation of data
⭐ Data cleaning
⭐ Remove null values
⭐ Fill null values with mean(), median() and mode()
⭐ Identify duplicate records
⭐ Remove duplicate records
⭐ Matplotlib Pyplot
⭐ Matplotlib Plotting
⭐ Matplotlib Markers
⭐ Matplotlib Line
⭐ Matplotlib Labels
⭐ Matplotlib Grid
⭐ Matplotlib Subplot
⭐ Matplotlib Scatter
⭐ Matplotlib Bars
⭐ Matplotlib Histograms
⭐ Matplotlib Pie charts
⭐ Creating Arrays
⭐ Array indexing
⭐ Array slicing
⭐ 1D Arrays
⭐ 2D Arrays
⭐ 3D Arrays
⭐ Array join
⭐ Array Search
⭐ Array filter
⭐ Table creation in Oracle
⭐ Oracle database connection in Python
⭐ Collections and documents in NoSQL
⭐ NoSQL database connection in Python
⭐ Creation of Database and Tables in MySQL
⭐ MySQL database connection with Python
⭐ Near real time examples with DB Connections
SQL Server
MANDATORY Topic 1: DATA, DATABASE AND DATAWAREHOUSE FUNDAMENTAL
⭐ Data and Data Availability in IT
⭐ Database, Data Warehouse, and RDBMS
⭐ Data storage areas [structured, semi and unstructured
⭐ RDBMS real-time projects and areas
⭐ Components of RDBMS
⭐ Normalized and de-normalized databases
⭐ [BI and non-BI]
⭐ SQL Versus T-SQL [MS SQL]
⭐ Other popular database in IT [ORACLE
⭐ and TERADATA] and differences
⭐ SQL Server Job Market and Opportunities
⭐ Power BI History, releases and blogs
⭐ Data warehouse, Data Mart and differences
⭐ Types of data marts and real-time usage
⭐ ODS, Stage, EDW, and DW definitions
⭐ Data Lake and Blob Storages
⭐ DWH Life Cycles
⭐ Data Granularity, Data movement stages
⭐ Installing SQL Server Instance and multiple Instances
⭐ SSMS Installation, Azure Data Studio, SQL Developer and Operations Studio
⭐ SQL Server Service Starting
⭐ Server name or Instance name & authentication
⭐ Versions and Editions in SQL Server
⭐ Connections [Local and Remote]
⭐ Editions of SQL Server – Enterprise Edition, Standard Edition, Developer Edition,
⭐ Work Group Edition, Express Edition
⭐ System Defined Databases & usages – Master, MSDB, TEMPDB and others real-time usage
⭐ User defined databases and usages
⭐ Database creation GUI and Code [MDF & LDF files]
⭐ Differences between command and query
⭐ Query and command execution in SQL Server
⭐ Parser, Compiler, Syntaxer, Optimizer, and CLRA
⭐ Storage Engine [SQL Engine]
⭐ SQL Server Data Definition Language [DDL]
⭐ SQL Server Data Manipulation Language [DML]
⭐ SQL Server Data Control Language [DCL]
⭐ SQL Server Transaction Dictionary Language [TCL]
⭐ SQL Server Data Retrieval Language [DRL]
⭐ Inserting data into table [SELECT, INSERT and SELECT]
⭐ Single Insert and Multiple Inserts
⭐ Modifying table data [UPDATE]
⭐ Removing table data [DELETE]
⭐ BULK INSERT and BCP [Bulk Copy Program]
⭐ MERGE command operation and Incremental Load [SCD and CDC]
⭐ SQL Server Data Types
⭐ Insert table from another table
⭐ Providing privileges [GRANT]
⭐ Removing privileges [REVOKE AND DENY]
⭐ Saving work [COMMIT]
⭐ Restore work [ROLLBACK]
⭐ Saving period of work [SAVEPOINT]
⭐ Working on SELECT statement
⭐ Working on WHERE, GROUP BY, HAVING, and ORDER BY
⭐ Column and Table Aliases usage
⭐ =, !=, <>, >, <, <=, =< etc… comparison Operators
⭐ AND, OR, NOT Logical operators
⭐ +, -, *, / , Mod, Exp etc…Mathematical Operators
⭐ Order By, Top, Where, From and Like
⭐ Group by and Having
⭐ IN, NOT IN, BETWEEN and NOT BETWEEN
⭐ ISNULL and NOT ISNULL
⭐ Simple Sub Query
⭐ Correlated Sub Query
⭐ Differences between simple and correlated
⭐ Nested Sub Query
⭐ Working on TOP, MAX, and MIN real time queries
⭐ Set theory generic protocols
⭐ INTERSECT
⭐ UNION
⭐ UNION ALL
⭐ EXCEPT
⭐ Working on incremental loading
⭐ JOINS real time usage
⭐ CROSS JOIN and CROSS APPLY
⭐ INNER JOIN [EQUI, NON EQUI]
⭐ NATURAL JOIN
⭐ SELF JOIN
⭐ INNER Vs. OUTER JOIN
⭐ LEFT OUTER JOIN
⭐ RIGHT OUTER JOIN
⭐ FULL OUTER JOIN
⭐ Working on ON and WHERE clauses
⭐ MERGE JOIN
⭐ LOOP JOIN
⭐ HASH JOIN
⭐ Unmatched data retrieval
⭐ Incremental load in real time using Joins
⭐ CHECK, NOT NULL, AND DEFAULT – Domain Integrity
⭐ Primary Key usage and limitations
⭐ Unique Key usage and limitations
⭐ Referential Integrity and FORGINE KEY
⭐ Candidate key and Alternate key
⭐ Normal column and Identity column
⭐ Surrogate key and Identity column usage
⭐ CASCADING OPTIONS
⭐ ON UPDATE SET NULL, ON UPDATE SET NO ACTION(Default)
⭐ ON DELETE CASCADE, ON UPDATE CASCADE, ON DELETE SET NULL,
⭐ Clustered Index Design and Structures
⭐ Nonclustered Index Design and Structures
⭐ Unique Index Design
⭐ Index with Included Columns
⭐ Column storage index
⭐ Full-Text Index population
⭐ Filtered Index Design
⭐ Covering Index Design
⭐ B-Tree and Online Indexes
⭐ Indexed views Vs. Materialized views
⭐ Fill Factor, TEMPDB, Pat_Index
⭐ Clustered Index Design and Structures
⭐ Nonclustered Index Design and Structures
⭐ Unique Index Design
⭐ Index with Included Columns
⭐ Column storage index
⭐ Full-Text Index population
⭐ Filtered Index Design
⭐ Covering Index Design
⭐ B-Tree and Online Indexes
⭐ Indexed views Vs. Materialized views
⭐ Fill Factor, TEMPDB, Pat_Index
⭐ Differences between GROUP BY and DISTINCT and performance impact
⭐ GROUP BY and HAVING usages to identify and eliminate duplicates
⭐ ROLLUP and CUBE usages
⭐ Generating FULL TOTALS and SUB TOTALS
⭐ Comparing ROLLUP, CUBE and GROUP functions
⭐ Advantages of Views in SQL
⭐ Tables Vs. Views
⭐ Simple View (Updatable View)
⭐ Complex View (Non-Updatable View)
⭐ Materialized View and real time usage
⭐ Encrypted views Vs. Cascading views
⭐ Limitations of Views
⭐ Date Functions – DATEADD, DATE DIFF, DATE PART, FLOOR, CEILING, GETUTCDATE,
, GETDATE, CURRENT_TIMESTAMP, SYSDATETIME, DATE NAME, ISDATE, WEEKDAY,
MONTHNAME, WEEKDAYNAME, SECOND, MINUTE, HOUR, ISDATE
⭐ Other Generic Functions – COALESCE, NULL IF, CURRENT USER, IIF, COALESCE,
NULL IF, CURRENT USER, IIF, SESSIONPROPERT, SYSTEM_USER, USER_NAME, FORMAT,
INSTR, CONCAT
⭐ Cast and Convert Functions
⭐ IF, ELSE, CASE, WHEN & END
⭐ PIVOT & UNPIVOT
⭐ ANALYTICAL FUNCTIONS – ROW_NUMBER () and real time examples, RANK () and real
time examples, DENSE RANK () and OVER () usages, NTILE advantage, PARTITION BY
advantage, Using Group BY along with Analytical Partition
⭐ User Defined Functions Create
⭐ User Defined Functions Calling
⭐ Differences between Function &Procedure
⭐ Use in Real Time and Types
⭐ System Defined and User Defined Procedures
⭐ Dynamic SQL Queries in Procedures
⭐ IN, OUT, INOUT Parameters
⭐ Compare Procedures and Functions
⭐ READONLY Parameters
⭐ Dynamic Data Insertions with Procedures
⭐ Table Variables, Cloning & Data Inserts
⭐ Using TEMP tables in procedures
⭐ Stored Procedure inside Stored Procedure
⭐ Optimizing tips for procedure
⭐ Local variables vs Global variables with examples
⭐ Local variables Vs. Temp variables and real time usage
⭐ TEMPORARY table usages in real time
⭐ Inline View Vs. Normal View
⭐ CTE: Common Table Expressions
⭐ CTE usage in real time
⭐ Multiple examples using CTE
⭐ ROW_NUMBER () with CTE Queries
⭐ Recursive CTE
⭐ IF, IIF, CASE
⭐ Error Handling in T-SQL
⭐ WHILE, WHEN
⭐ Try, Catch, Throw
⭐ Creating Dynamic SELECT statement
⭐ Passing dynamic table names
⭐ Create a procedure with dynamic table names and variables
⭐ Normal SQL Vs. Dynamic SQL
Advantages of Learning Data Analytics Course in Hyderabad
Learn Industry-Relevant Tools
Gain practical skills in Power BI, Excel, SQL, Python, and Tableau for modern data analytics and reporting.
Develop Business Insights
Learn to analyze customer behavior, market trends, and business performance to support data-driven decisions.
Build Interactive Dashboards
Create professional reports, KPIs, and interactive dashboards using Power BI, Power Query, and DAX.
Practical & Enterprise Skills
Learn data modeling, transformation, visualization, and reporting techniques used in real-world business environments.
Beginner-Friendly Learning
Start with essential analytics tools and gradually develop advanced skills without requiring extensive programming knowledge.
Work With Multiple Data Sources
Learn to connect and analyze data from Excel, SQL Server, Azure, SharePoint, and other sources.
Real-World Applications
Apply Data Analytics skills to sales, finance, HR, marketing, customer analytics, and business reporting.
Career-Focused Skills in Hyderabad
Build practical skills through Data Analytics Course in Hyderabad and prepare for opportunities in data analysis, business intelligence, and reporting.
Why Data Analytics Course in Hyderabad with Vinay Tech House?
Practical Learning – Learn Data Analytics through real-time scenarios, hands-on exercises, and practical case studies.
Industry-Experienced Trainers – Learn from trainers with real-world Data Analytics experience.
Recorded Sessions – Access recorded classes anytime for revision and practice.
Flexible Batches – Choose weekday, weekend, or fast-track batches based on your schedule.
Online & Offline Training – Attend Data Analytics Course in Hyderabad through flexible learning options.
Affordable Course Fees – Flexible payment options make our Data Analytics Course in Hyderabad accessible to learners at different levels.
Data Analytics Course in Hyderabad
Frequently Asked Questions
Data Analytics Course in Hyderabad
No, This Data Analytics course is designed for beginners as well as professionals. We start from the basics and gradually move to advanced topics.
You’ll gain hands-on experience with:
Excel (Advanced)
SQL
Power BI / Tableau
Python for Data Analysis
Statistics & Data Visualization Tools
Yes. We provide a free demo session to help you understand the teaching style and course content before enrolling.
As of 2025, entry-level data analysts in India earn between ₹4 LPA to ₹7 LPA, while experienced professionals can earn up to ₹12–20 LPA, depending on skills and domain expertise.
Yes. We offer 100% placement support, including:
Resume and LinkedIn profile building
Mock interviews
Job referrals from our hiring partners
Access to our exclusive job portal
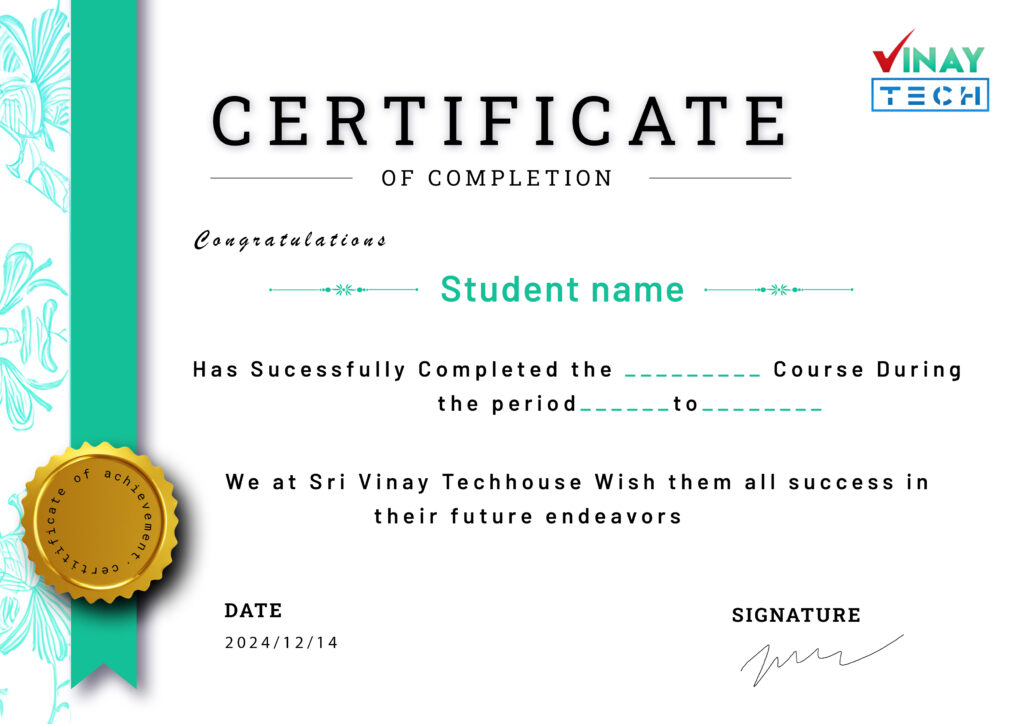
Get certified by VinayTech House
Get certified by Vinay Tech and boost your career with industry-recognized certifications. Our expert-led training across various courses ensures you gain practical skills that employers value. Complete your course and earn a certificate that showcases your expertise and commitment to professional growth.
Data Analytics Course in Hyderabad
Our Learners Work At









Related Courses