Power BI Course in Bangalore
Enroll in Power BI Online Course in Bangalore at Vinay Tech House and gain real-time skills to analyze, visualize, and present data. Create interactive dashboards and share insights that support business intelligence and strategy.
Over 300+ reviews

Get a Free Demo
What is Power BI?
Power BI is a leading business intelligence (BI) and data visualization tool developed by Microsoft. Designed for both technical and non-technical users, Power BI allows you to connect to multiple data sources, clean and transform data, and create interactive reports and dashboards—all without needing deep coding skills.
With Power BI, businesses can turn raw data from sources like Excel, SQL databases, SharePoint, cloud services, and more into clear, actionable insights. Whether you’re analyzing sales performance, customer trends, or operational metrics, Power BI helps you make data-driven decisions faster and with more confidence.
You can also explore Microsoft Power BI documentation and tutorials to deepen your understanding and unlock the full potential of this powerful BI platform.
Students can Expect
When you join our Power BI Training in Bangalore, you can expect:
Why learn Power BI?
Microsoft Power BI is one of the most in-demand business intelligence tools used by top companies worldwide for data visualization and decision-making.
- User-Friendly Interface – Drag-and-drop experience, perfect for beginners
- Connects to Multiple Sources – Excel, SQL Server, Web APIs, Azure, and more
- Data Modeling & DAX – Create complex calculations and relationships
- Interactive Dashboards – Visualize your data with charts, maps, and tables
- Real-Time Reports – Monitor your business performance on the go
- Widely Used Tool – In high demand across industries like finance, healthcare, retail, and IT
At Vinay Tech House, our Power BI training program is designed to mirror real-world business environments—just like the image above, where professionals collaborate, explore data, and uncover actionable insights using powerful visualizations.
In today’s data-driven world, knowing how to analyze and present data effectively is a critical skill. Our Power BI course takes you beyond theory, immersing you in hands-on projects where you’ll learn to design dynamic dashboards, work with interactive charts and graphs, and build professional-grade reports that communicate clear stories from complex data.
What you’ll experience with us:
Work in simulated data environments, just like industry analysts
Create rich visuals using pie charts, bar graphs, KPIs, and trend lines
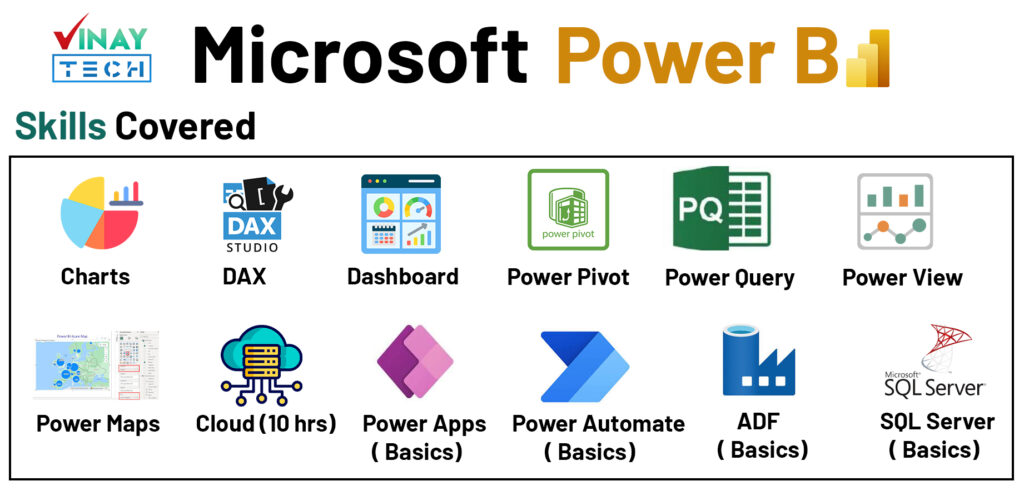
Master Power Query, DAX, Power Pivot, and Power View
Learn how to connect to diverse data sources and clean data for reporting
Understand how to build dashboards that drive business decisions
Receive mentorship and support from industry-expert trainers
Apply skills through live, real-time datasets and business cases

Whether you’re a beginner stepping into analytics or a working professional upskilling for career growth, our Power BI course helps you move from data consumer to data storyteller.
Career Opportunities After Completing Power BI Training
Data Analyst – Interpret data to drive strategic decisions
Business Intelligence (BI) Analyst – Create reports and dashboards for business insights
Data Visualization Specialist – Turn data into compelling visual stories
Power BI Developer – Build and manage Power BI solutions for organizations
BI Consultant – Advise companies on BI solutions and reporting
Reporting & Insights Analyst – Deliver actionable insights through dynamic reporting
Analytics Executive – Monitor performance metrics and recommend improvements
Self-Service BI Specialist – Empower teams to explore data independently
Graduates
Kickstart your career in data analytics with essential Power BI skills.
Working Professionals
Upgrade your profile with in-demand business intelligence and visualization tools.
Career Change
Make data-driven decisions by creating insightful reports and dashboards.
Who Uses Power BI?
- Business Analysts
- Data Analysts
- Managers & Executives
- Finance & Sales Teams
- Students & Freshers entering the BI field
Power BI Components
- Power BI Desktop
- Power BI Service (Online)
- Power BI Mobile App
- Power BI Gateway
- Power BI Report Builder
Power BI Is Used For
- Business performance tracking
- Sales and marketing analysis
- Financial reporting
- Operations and inventory monitoring
- Customer and employee insights
Available Modes
For only Recorded Sessions / Corporate Training, Contact us at +91 9859831831
Power BI Course Features
Learn Power BI in Bangalore – From Basics to Advanced
Expert Trainers
Learn from certified professionals with real-world industry experience.
Comprehensive Curriculum
Covers everything from Power BI basics to advanced topics like DAX, Power Query, and data modeling.
Hands-On Real-Time Projects
Work on live datasets and industry-relevant projects to gain practical experience.
Placement Assistance
Get help with resume building, interview preparation, and job placement support.
Certification
Receive a recognized Power BI certification upon successful course completion.
Lifetime Support
Access course materials and get your doubts cleared even after the course ends.
Power BI Course in Bangalore
CURRICULUM
MANDATORY Topic 1: POWER BI DEMO AND DATA WAREHOUSE FUNDAMENTALS
Data, Data Availability types in IT
IT data storage areas [File stream, Database]
Data warehouse, BI definitions and layers
Power BI existence in IT, Product services
Power BI Features, Self Service BI
Power BI Tools and Components
On-Premises vs. Cloud
Power BI Opportunities vs Support
BI history, MSBI, Azure BI, Power BI
OLAP vs. OLTP vs. Insights and Analytics
Power BI history, releases and blogs
Power BI usage in IT Companies
Microsoft Power Platform & Fabric Features
Data warehouse, Data Mart and differences
Types of data marts and real-time usage
ODS, Stage, EDW, and DW definitions
Data Lake and Blob Storages
DWH Life Cycles, DWH principles
DWH Approaches (INMON and KIMBALL)
Data Granularity, Data movement stages
MANDATORY Topic 2: DATA MODEL THEORY AND PRACTICAL
Data model, use of data model in Power BI
Business, Conceptual, Logical, Physical models
Dimension, Dimension table & types
( Conformed, RolePlay, Degenerated, Junk, SCD)
Measures & Types
(fully additive, semi additive, non additive)
Fact table & Types
(Snapshot, Incremental, Factless fact)
Schemas (star, Snow Flake, Galaxy & Hybrid)
Surrogate key and usages in real time
1:1, 1: Many, Many: Many relationships
Active, Inactive relationships
Single and Bi-directional, Cross filter
Advanced properties of fields
(sort order, date category, aggregators)
Snow Flake schema exmaples
TOPIC 1: INSTALLATION [Power BI DESKTOPS, GATEWAY, SERVER, REPORT BUILDER & DAX STUDIO]
Power BI Components
Release impact on installation
Power BI Cloud Desktop installation
Power BI Report Server Desktop installation
DAX Studio installation
Report Server installation
Paginated Report Builder Installation
Gateway Installation
TOPIC 2: WORKNG WITH POWER BI DESKTOP AND CONNECTING TO MANY DATA SOURCES
Desktop over view and Building blocks of PBI Desktop
Connecting to various sources and retrieving data
1. Flat files
2. CSV files
3.JSON files
4. Databases (SQL Server & Oracle)
5. Excel files
6. Web
7. Analysis Services Models [Tabular & Multi-dimensional model]
8. Azure SQL database and DWH
9. Python Script
10. M- Retrieval
11. Multiple files load at a time
TOPIC3: WORKING DATABASES, CUBES, MODES & CHANGING MODES
Working on data modes [very detailed] Import
Import
Direct Query
Connect Live
Mixed mode
Changing modes
Differences between Load and Edit options.
Retrive date from related data bases and cube
TOPIC4: WORKNG ON POWER BI MODES [ IMPORT, DIRECT QUERY, AND CONNECT LIVE]
Power view
Power query
Power map
Power pivot
TOPIC 5: POWER BI VIEW MENU TAB OPTIONS-RIBBON OPTIONS & REAL-TIME
New, open, save report
Export Power BI template (PBIT), PDF
Import Power BI Template, Power Query, View, Model, Visual files
Options and Settings & About
External Data: Get Data, Recent Sources, Enter Data
Transform data & edit parameters
Publishing to cloud service
Prop data AI (2025)
Quick sources
sensitivity
Report Phone Layout / Desktop View Show Gridlines, Snap Objects to Grid Locking Objects on the surface
Bookmarks creation, viewing, & using in Dashboard Selection Pane [Hiding and showing objects]
Slicer and Sync Slicers explanation with practical Performance analyzer test run
Scale to fit: Page view, Mobile: Mobile layout, page options
Show panes: Filters, Bookmarks, selection, Performance Analyzer, Sync slicers
Relationships: manage Relationships
Create roles and implement row-level security & dynamic row-level security
Page Refresh: Change detection
Parameters: New parameters
security: Manage roles, View as
Calculations: New measure, Quick measure, New column, New table
Q&A: Language, Lunguistic schema
Guided learning, documentation, training videos, blogs, communities, Power BI for developers, Support and Consulting Services
Edit interactions for the visual for cross highlighting, cross filtering, and none options.
Bring forward, send backward etc…visual option (Z-Order)
Drill down report creation
Drill one level down, multiple levels, and data drill
Visual table, Data point table
Visuals: New Page, New Visual, More Visuals
AI Visuals: Key influencers, Decomposition Tree, Smart Narrative, Q & A
Elements: Text box, Buttons, Shapes, Image
Power Platform: Paginated Report, Power Apps, Power Automate
Sparklines: Add a Sparkline
DAX studio
Refresh, Pause, Preset, Optimization
TOPIC 6: POWER BI DATASET PROPERTIES
Create hierarchies and analyzing data.
Create Groups (List, Bin)
Hide / Unhide columns usage in real-time
Consider table as Date Table
Expand and collapse columns
Incremental refresh & manage aggregations
TOPIC 7: POWER QUERY PROPERTIES [ 8 types of properties and M-Language]
Real-time practical on duplicates and references
Create groups to classify tables
Refreshing table data and enabling data to tables
Creating reusable functions
Perform data transformations by adding, removing and retaining columns, duplicates, errors.
Working on reusable functions
Merging multiple queries
Joining multiple queries to get matched, unmatched and both matched and unmatched rows.
Data types, Different types of data transformations on
a) Numeric columns
b) String columns (split strings)
c)Date columns
Full real-time examples on the data transformations
Working on Number, String, and Date
Various filter options
Working on Any, List, and Query Parameters
Working on multiple parameters
Working on cascading parameters
Working on cascading parameters
Transpose rows, reverse rows, pivot & unpivot
View options [monospaced font, column profiling, column distribution, performance monitoring]
Syntax, protocols, variables and conventions
Let, In, semicolon, and other functions
TOPIC 8: POWER BI VIEWS , FILTERS, VISUALS AND VISUAL FORMATING OPTIONS
Report View
Data View
Relationship View
DAX Query view (2024)
Visualization level
Page level
Report level
Drill though page level
Drill through cross report level
Card, Multi-row, Table, Matrix, New-card (2024)
Charts
Rounded charts: Pie, donut
Bar: Stacked, Clustered, 100% stacked
Trend: Line, Area, Stacked Area, Ribbon, Mixed Charts, Rectangle Tree Map, Funnel, scatter, Waterfall
Maps (Bubble, Filled, Shape, ARCGis, Azure map 2024)
AI Visuals: Key-influencer, De-composition, Smart Narrative, QA
Others: Sparklines, metric, Paginated Report, R, Python
Bullet Chart
Chiclet Slicer
Hierarchy Slicer
Gantt Chart
Histogram Chart
Dual KPI
Scroller
Image
Textbox
shapes
Button actions
Actions: Bookmark, page navigation, back, QA, URL, apply slicers & clear slicers
Dual KPI
Scroller
Slicers: types, usages, sync slicer
Filers & types
Edit Interactions
Parameters & What-if parameters
TOPIC 9: POWER BI CLOUD SERVICE (app.powerbi.com)
Navigation pane
Portal URL explanation
App Launcher
settings
Help & Support
Feedback
Account information
Add dashboards, reports, and work books
My workspace and properties
User app workspaces and properties
Workspace Settings and Roles
workspace Access
Create dash board
Add the below tiles
a) Image tile
b) Text box tile
c) Video tile
d) Streaming tile
e) Live page tile
f) Visual tile
g) Book mark tile
h) Workbook tile
i) Insight tile
j) Usage Metrics tile
Share and Subscribe dash board
Refresh Dashboard
Manage Alerts
Tile & dashboard properties
Real-Time dashboards practice with more DAX
Create, modify, and delete appspace
Add content (show or hide)
Audience (organization or users)
Additional Settings (copy, build)
Publish and Update app
Browse App in Web, Desktop and Mobile
END USER EXPERIECE PROVIDED
Settings (Admin Operations)
- Manage gateways & sources
- Admin portal
- item setting, Language setting, QA
- Manage group storage
- Manage Personal Storage
Refresh (on-demand and scheduled)
Security ( Row Level Security)
Download, Generate reports, Paginated reports
Dataset Setting (Gateway and others)
Parameters & Data Source Credentials
Data Connections
Cache Setting > QA setting > manage permissions
Download and Install Power BI Gateways
Install & Configure Gateways
Add Data Sources
Desktop, Service, and Mobile App
Refresh (on-demand, scheduled and automated)
Gateway trouble shooting
Refresh Flat Files & data bases
Deployment and Deployment pipelines
New and updates entities deploy
Setting, Access, History of pipelines
Edit Report, Mobile and Web View
Quick Insights and usage Metrics
Persistent Filters and Cross Report
Share, Subscribe, and Refresh
Lineage view, View Related
Comments and Chatin Teams
Manage permissions
Scorecard and Metrics or Goals Refresh Metrics
Create and modify dataflow
Power Query Operations
Common Data Model [CDM] usage
Save and use Dataflow
Refresh (On-demand, scheduled, Incremental Refresh)
TOPIC 10: DAX [DATA ANALYSIS EXPRESSIONS] DAX Expression, Query Language & DAX Studio (10 hrs)
Syntax and usage
Naming conventions, parameters
Operators, functions (15 categories)
Context transition (row, column, filter, multi-row)
DAX Queries, DAX Studio and SSMS
DAX FAQS, Optimization & Standards
Good material provided for all the functions
a) Date b) Filter c) Math & Trig d) Statistical e) Table Manipulated f) Informational g) Relationship h) Logical i) Parent Child j) Time Intelligence k) INFO Function l) Windows Functions (2022 Dec) m) NEW Functions (2024)
Statements: Evaluate, Define, Var, Order By
Calendar, Calendarauto, Day, Month, Year YearFrac, Date, Time, DateValue, TimeValue, Edate, EOMonth, Weekday, WeekOfMonth Today, UTCToday, Now, UTCNow, DateDiff
And, Or, Not, Iferror, If, Switch, In, True , False, Coalesce
Path, Pathlength, Pathcontains, Pathreverse, PathItem
Addmissingitems, Filter, Filters,Distinct, Values, Countrows, All, Allexcept, Earlier, Earliest, KeepFilters, Remove filters, Calculate, Calculatetable, AllSelected, AllNoBlankRow
Related, Relatedtable, UseRelationship, Crossfilter, ContainsStringExact
ContainsRow, Contains, ContainsString, Iseven, Isodd, Istext, UserName, UserPricipalName, LookUpValue, IsError, IsNonText, IsNumber, IsLogical, Isinscope, Isonorafter,Hasonefilter, IsCrossFiltered
Sum, Sumx, Average, AverageX, AverageA, Max,MaxX,MaxA, Min, Minx,MinA,Count, CountX, CountA, CountBlank, DistantCount, DistantCountNoBlank, Product, ProductX, Courtrows, Approximate, Distinctcount
Permut, Rank.eq, Rankx, Sampl, Statistical data, Operation functions
AddColumns, AddMissingItems, CrossJoin, CurrentGroup, DataTable, DetailRows, DistinctColumn, DistinctTable, Except,Filters, Generate, GenerateSeries, Groupby, DataTable, Except, Intersect, Union, Symmarize, Summarizecolumn, GenerateSeries, NaturalInnerJoin, NaturalLeftOuterJoin, Crossjoin, Treatas, Isempty, Row SelectColumns, Values,
Blank, Code,Unichar,Concatenate, Combinevalues, Cacatinatex, Trim, Rept, Replace, Substitute, Find, Search, Format, Mid, Left, Right, Value, Upper, Lower
TOPIC 11: ADDITIONAL SESSIONS [MICROSOFT FABRIC UNDERSTANDING, AZURE SESSIONS]
Azure cloud and introduction
Azure portal, resources, and resource groups
Azure account creation and pay-as-you-go
Azure Sql Database, Data warehouse, and Analysis Services Databases
Aure Blob and Data Lake Storages Introduction
Azure Data Factory [ADF] Introduction
ADF- Pipelines, Sources, Sync, and Azure Log Analytics Workspace
Azure Active Directory [AAD]
TOPIC 12: POWER AUTOMATE, POWER APP & POWER BI EMBEDDING
Microsoft Power Automate [Microsoft flow]
Power Automate overview
Flow.microsoft.co understanding with accounts and components
Scheduling the Dataset refresh
Implement set of operations using flow EMAIL, Dataset Refresh, Power Apps
Power Apps Overview
make.powerapps.com understanding
Understanding different apps
[Canvas, Model Driven, Portal from Blank]
Power Apps few scenarios practice
APP showing Power Bi Report [Embedding] APP to connect to report and edit details. Create and manage a data form OneDrive
Basic Material and Live Class Videos Shared
Advantages of Learning Power BI Online Course in Bangalore
Versatile Business Intelligence Tool: Power BI can be used for a wide range of business analysis, data visualization, and reporting needs across any industry.
Better Market Understanding: It helps professionals and businesses gain deeper insights into market performance and trends through real-time data analysis.
Effortless Report Creation: With Power Query and built-in features, you can easily import data, analyze it, and present insights using intuitive charts and graphs.
Powerful & Interactive Visualizations: Power BI enables users to transform raw data into dynamic, interactive reports and dashboards that are easy to interpret.
Enterprise-Grade Analytics Platform: Designed by Microsoft, Power BI is trusted by large organizations for its scalability, security, and integration with other Microsoft tools.
User-Friendly Interface: Its graphical interface allows users to build dashboards and reports quickly—often with just a few clicks—making it ideal for beginners and professionals alike.
Multi-Purpose Utility: Whether for sales, finance, operations, HR, or marketing, Power BI can be tailored to meet the unique analytical needs of any department.
Seamless Data Integration: Power BI supports importing data from a wide variety of sources including Excel, SQL databases, SharePoint, cloud services, and APIs.
Superior to Traditional Tools: Compared to Excel or Google Sheets, Power BI offers advanced features like real-time data refresh, cross-platform sharing, DAX calculations, and custom visuals.
Daily Workflow Enhancement: Its rich set of features makes it a go-to tool for professionals looking to automate analysis, save time, and improve decision-making in their day-to-day tasks.
Why Choose Power BI Course in Bangalore with Vinay Tech House?
A complete learning solution that offers real-time, hands-on training across every module of Power BI—designed to make you job-ready.
We provide industry-relevant case studies to help reinforce concepts with practical examples.
Sessions are customized to your schedule and delivered by expert trainers with real-time industry experience.
All classes are recorded and shared for future reference, allowing you to revise at your own pace.
We offer flexible batches including weekday, weekend, and fast-track options for both online and classroom modes.
Our affordable and flexible payment plans are designed to suit working professionals, students, and corporate learners.
Frequently Asked Questions
Power BI Course in Bangalore
“Powering BI”, added more features to the existing BI. It is a Self Sevice Business Intelligence (SSBI) Software Service which generates Reports and Dashboards for better Decision Making and quick Insights
It is easy to learn since it is a Low-Code application ( full support to graphical)
We’ve got you covered. We record Daily Live Classes and share the records everyday. You can watch at your own time, practice and ask the trainer any queries you have
Yes, Microsoft is the leader in Analytics and Business Intelligence since 16 years. It is providing its wonderful support to the current cutting edge processes and technologies by its monthly updates. And also On-Premise MSBI and Cloud Azure BI providing other BI supportive services beside Power BI. Kindly visit the following links to know more about the Power BI Market & Leadership
– https://powerbi.microsoft.com/en-us/blog/microsoft-named-a-leader-in-the-2022-gartner-magic-quadrant-for-analytics-and-bi-platforms/
– https://powerbi.microsoft.com/en-my/blog/microsoft-named-a-leader-in-the-forrester-wave-augmented-bi-platforms-q3-2021/
Key features of Power BI include intuitive data visualization tools, seamless data integration from various sources, robust analytics capabilities, interactive dashboards, real-time data updates, natural language querying, collaboration tools, and enterprise-grade security and compliance measures.
Individuals and professionals across various industries, including data analysts, business intelligence professionals, financial analysts, marketers, operations managers, and decision-makers, can benefit from Power BI training. Additionally, anyone seeking to enhance their data analysis skills and leverage data-driven insights to drive business success can find value in Power BI training.
Our Learners Work At


Join us Today
Ready to upgrade your skills and build your career?
Vinay Tech offers hands-on training, expert mentorship, and full support to help you succeed in today’s competitive world. Whether you’re a student or a working professional — your journey starts here.
Get certified by VinayTech House
Upon successful completion of the course, you will receive a Vinay Tech Course Completion Certificate. This certification enhances your resume and can significantly boost your chances of securing top job roles in leading multinational companies (MNCs). The certificate is available both as a digital copy and a printable hard copy, providing flexibility based on your needs.